
The Cost of a Problematic Culture
Over the past decade, I’ve gathered hundreds of data points on company productivity, shaping my thinking and influencing the four key productivity cultures I’ve outlined in UNBLOCK. Across all this data, over 80% of organisations fall into either the traumatic or problematic cultures — both marked by lethargy and low Productivity Wage Quotients (PWQ), typically below 1.7.
To bring this into focus, let’s consider a case study of a UK manufacturing company from my sample. This company, operating in the B2B market, employs around 148 full-time equivalent team members (FTEs). With an output per worker of £26,974 and an average wage of £24,170, the company’s PWQ stands at 1.12 — firmly placing it in the problematic culture category.
Projecting Productivity Growth
Let’s examine how this organisation might evolve over five years under two different productivity growth scenarios: 0.4% and 2.3% annual growth. 0.4% represents the annual productivity growth of the UK economy since 2008 and 2.3% represents the long term growth rate prior to the 2008 recession.
Scenario 1: 0.4% Productivity Growth
Assuming headcount remains static and wages increase modestly by 0.75% per year, the organisation’s productivity grows by just 0.4% annually. This results in an additional £80,546 in value added (VA) after five years. However, the PWQ remains stagnant. Even with wages frozen, the PWQ doesn’t exceed 1.14 by year five.

0.4% annual productivity growth example
Scenario 2: 2.3% Productivity Growth
Now, let’s see what happens with a 2.3% annual productivity growth rate — the long-term historical average before the 2008 financial crisis. With the same wage increase of 0.75% per year, the company adds £481,077 in value over five years, thanks to the compounding effect of higher productivity growth rates. The PWQ improves significantly, moving the organisation closer to a systematic culture, though there’s still work to be done.
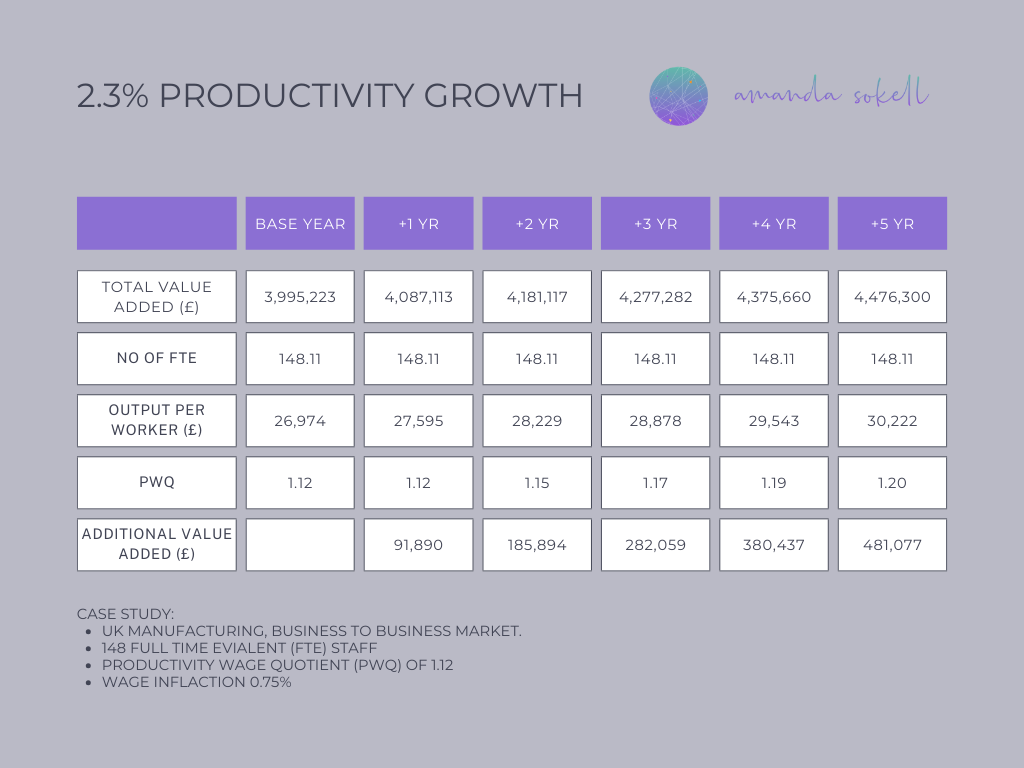
2.3% annual productivity growth example
If there’s no wage inflation, the PWQ climbs to 1.25 at the end of five years — a promising trajectory towards a more systematic culture.
Bridging the Gap to Systematic Culture
So, what level of productivity growth is needed to reach a PWQ of 1.7 (the threshold between problematic and systematic cultures) within five years? The answer, assuming no wage increases, is a staggering 8.8% annual productivity growth.
To put this into perspective, achieving an 8.8% growth rate is extraordinary, particularly against the backdrop of the UK’s 0.4% annualised growth over the past 16 years. This highlights the magnitude of the challenge ahead.
This case study underscores the profound impact of organisational culture on productivity. While modest productivity gains barely shift the needle, a systematic approach to fostering a culture of productivity can drive significant value. The question remains: does your organisation have the right culture to meet this challenge head-on?